In outline, a progress report has the following content (based on the BDTM method with the four aspects of Result, Risks,
Time and Costs). In practice, the list of contents may follow a different sequence; subjects may be combined, or even
omitted. It depends on the report’s target group.
-
1. Status of the test object (BDTM: Result)
-
1.1 Status per characteristic/object part
-
1.2 Status of test goals
-
1.3 Trends and recommendations
-
2. Product risk and strategy adjustment (BDTM: Risks)
-
3. Progress of the test process (BDTM: Time and Costs)
-
3.1 Progress (in hours and data) of activities or products over the recent period
-
3.2 Activities in the coming period
-
3.3 Hours lost
-
3.4 Trends and recommendations
-
4. Problem areas/points of discussion (all the BDTM aspects)
-
5. Agreements
-
6. Quality of the test process (optional, all the BDTM aspects)
-
6.1 Effectiveness
-
6.2 Efficiency
-
6.3 Verifiability
These subjects are further explained below:
1. Status of the test object (Result)
1.1 Status per characteristic/object part
It is shown per characteristic/object part:
-
The status of the tests (not started, planned, specifi cation, execution, retest X, completed), optionally with the
progress percentage, e.g. the progress of the execution is estimated at 60%
-
Overview of numbers of defects (sorted by status and severity, optionally also by other aspects, such as cause).
-
If test products (such as test cases or test scripts) are seen emphatically as results, they can also be included
in the overview, with an indication of whether a start has been made on the product and whether it is ready.
The closer the end of the test period approaches, the more attention is paid in the progress report to the consequences
of open defects. In the beginning, it is less useful to include this in the report, since it is expected that the
defects will be solved. But the consequences should always be included in the defect report itself.
-
Defects that remain open and their impact
-
Defects not solved (known errors), and their impact.
1.2 Status of test goals
Based on the above, the status per test goal (user requirement, business process, critical success
factor, etc.) is reported. Sometimes a test goal can be directly linked to a number of characteristics/object parts and
to the test status related to them; sometimes the status per characteristic/object part is not sufficiently usable and
the test manager still has to determine the test status per test goal. The risk tables from the Product Risk Analysis
make the link possible.
1.3 Trends and recommendations
Relevant trends and related recommendations can be reported here.
Below are some overviews that will reveal whether certain trends are taking place:
-
The number of open defects per week will indicate whether the testing can tail off or if a backlog is building up.
-
The relationship between numbers of defects and test cases per subsystem provides an indication of whether extra
testing on that part will deliver many more defects.
-
The number of found defects and number of solved (including retested) defects within a certain period says
something about the stability of the system.
-
Status of the defect versus who should carry out the following step in the handling of it. This shows up where any
bottleneck lies. For example, where all the complex faults are allocated to that one experienced developer, with
the result that a backlog of unsolved defects is created.
-
Cause of defects (requirements, design, code, test environment, wrong installation/operation, wrong test case)
versus subsystem. Provides insight into the concentrations of specific mistakes.
-
Number of defects versus tables (with data warehousing). This tells us what the error-sensitive system parts are.
In order to give the trend significance for the stakeholders, it is advisable to use graphics, making the trend
visible. This is not as easy as it seems. It is difficult to produce a clear and legible graphic. A few tips (quoted
freely from [Tufte, 2001]):
-
Make the data and the message the centrepiece
-
Maximise the data/ink ratio (i.e. leave out all the symbols, lines and colours that don’t add anything)
-
Remove redundancies
-
Review and amend.
2. Product risk and strategy adjustment (Risks)
In this part of the report, the stakeholders are given insight into the degree to which the coverage of the
various product risks has changed, as well as into any process risks.
In the test plan strategy, it is determined whether and to what degree product risks will be covered by testing. During
the test process, aberrations may occur: the estimate of the risk appears different and/or the test coverage requires
adjusting. The adjustments over the reporting period, with associated consequences, are reported in this part. In this,
the translation is made into the test goals: what kind of impact will the changed risks have on the attainment of these
goals?
3. Progress of the test process (Time and Costs)
Regarding the progress of the test process, the points below are significant.
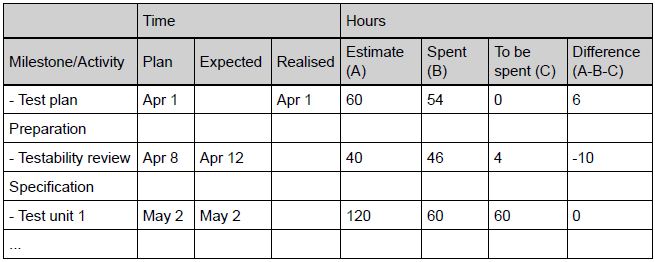
3.1 Progress over the latest period
At the level of phases and/or main products, the following could be reported:
-
Number of planned hours
-
Number of hours spent so far
-
Number of hours expected still to be spent
-
Percentage completed
-
Dates: planned/expected/actual start date; planned/expected/actual end date.
Products could be the test plan, test scripts, test-execution files and reports.
If the test manager is responsible for the budget, he will also include in the progress report information on
completing the test process within budget.
3.2 Activities in the coming period
Here, the activities to be carried out in the coming period are reported.
3.3 Hours lost
This refers to non-productive hours of the testers. If the test process environment does not meet certain
preconditions, this will result in inefficiency and loss of hours. Examples are a non-functioning test infrastructure,
much or lengthy test-obstructing defects or lack of support. Hours lost, and the causes, are reported here.
3.4 Trends and recommendations
As with trends in the status of the test object, trends and recommendations in connection with the progress of the
testing should also be reported. The central question here is whether the agreed milestones are (or appear to be)
feasible.
One of the trends that can be watched is the average time required for the reworking of a defect. If this increases, it
is possibly a signal that the volume of the backlog of work is increasing sharply. The percentage of wrongly reworked
defects can also be observed.
4. Problem areas/discussion points (all the BDTM aspects)
In this section of the report, the test manager points out any problem areas or points for discussion that jeopardise
completion of the test assignment within the set limits of time and costs. For example:
-
The test object being delivered later than planned
-
The quality of the test basis being less than expected
-
The test environment not being available on the agreed date
-
Test-obstructing defects present in the test environment or test object.
Besides the various problem areas, their consequences and possible measures are shown. Here, too, the test manager
makes the translation into the test goals.
5. Agreements
This part shows the agreements made in the current period between the test team and other parties that are relevant to
the recipients of the report.
6. Quality of the test process (optional)
If required, this part of the report can include information on the quality of the test process. The following
questions play a part here:
-
Are the significant defects being found (as early as possible)? (Effectiveness)
-
How economical is the test process with time and resources? (Efficiency)
-
Is the test process working as agreed? (Verifiability)
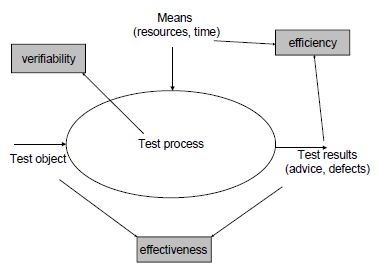
Figure 1: The three quality aspects of the test process
A point of focus here is the general problem with metrics: how to draw the right conclusions from the figures; how to
avoid comparing apples with oranges. See also Metrics.
6.1 Effectiveness
The difficulty with the question of whether the testing is effective, is that this can usually only be
established in retrospect. The effectiveness issue can be split into two parts:
There are various indicators that can be included in the report:
-
The percentage of found defects in the test level / the number of defects present or an approximation thereof;
the number of defects can be approximated by, for example, the number of defects still being found during the
first 3 months of production.
-
The percentage of found defects in a test level that should reasonably have been found in a preceding test (30%
of the defects found in the acceptance test concern programming defects; these should actually already have
been found in the development tests and system test).
-
Degree of testing coverage; the more thorough the test, the more defects will be found.
-
The percentage of mistakes (= test faults).
6.2 Efficiency
The following are possible indicators of this:
-
The number of defects found per test hour
-
Estimating prevented damage in relation to the test costs (through fi nding faults)
-
Number of specified or executed test cases per hour
-
Number of reviewed pages per hour.
By comparing these figures with an established standard, a picture is created of the efficiency of the test
process.
6.3 Verifiability
This aspect is difficult to communicate through indicators. What the test manager can say in the report
about this is whether and how in the latest period it was verified that the test team was working as agreed. The
verification can focus on the test products or the processes and can be based on the planned quality measures, or on
monitoring, or on a random check at the overall level. The test manager should make a good risk estimate as regards
what checking would be useful. In particular, the test levels that are placed with inexperienced test managers or that
have been outsourced are eligible for verification.
Below is an example of a dashboard, enabling the most important information to be seen at a glance.
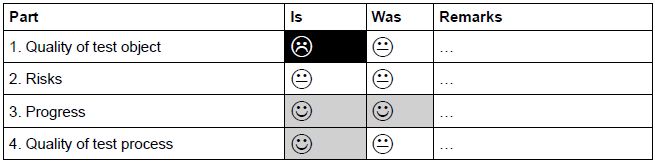
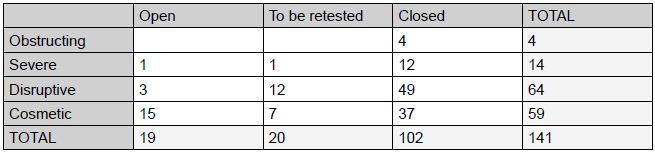
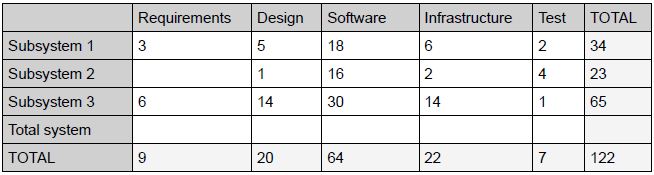
Later in the report, these points are worked out in detail in overviews with notes. Examples of overviews (without
notes):
-
Quality of test object - defects
-
Quality of test object – subsystem x causes
-
Progress
|
